@billstevenson
Have you noticed how often I paste photos? I think it ’livelys up’ the posts, I wish more people posted images. It was a mystery, until it wasn’t.
this is a lot of words, but it’s much easier once you get it down.
The KEY is the image must be ONLINE
.....................................................
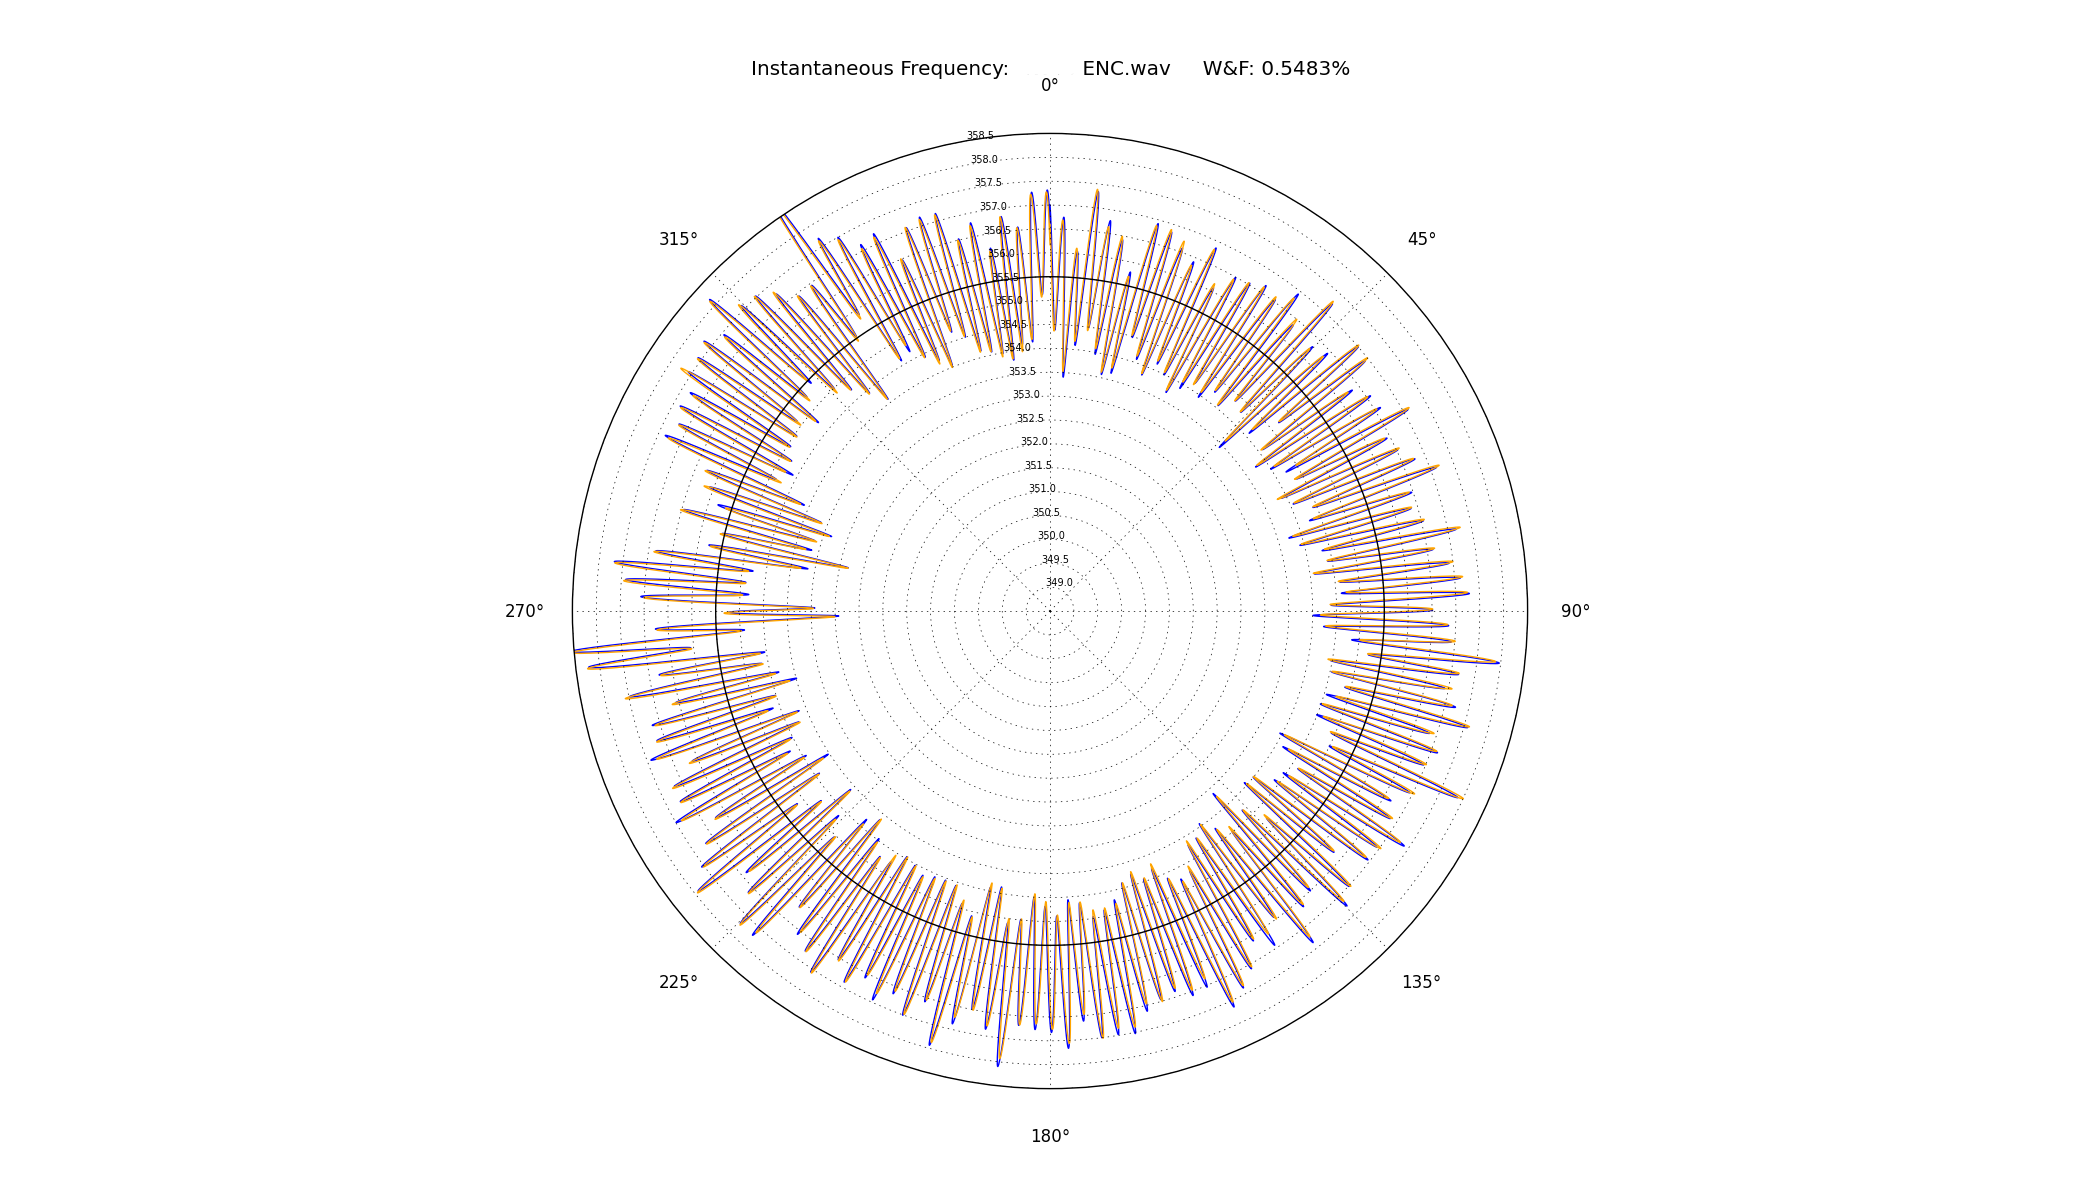
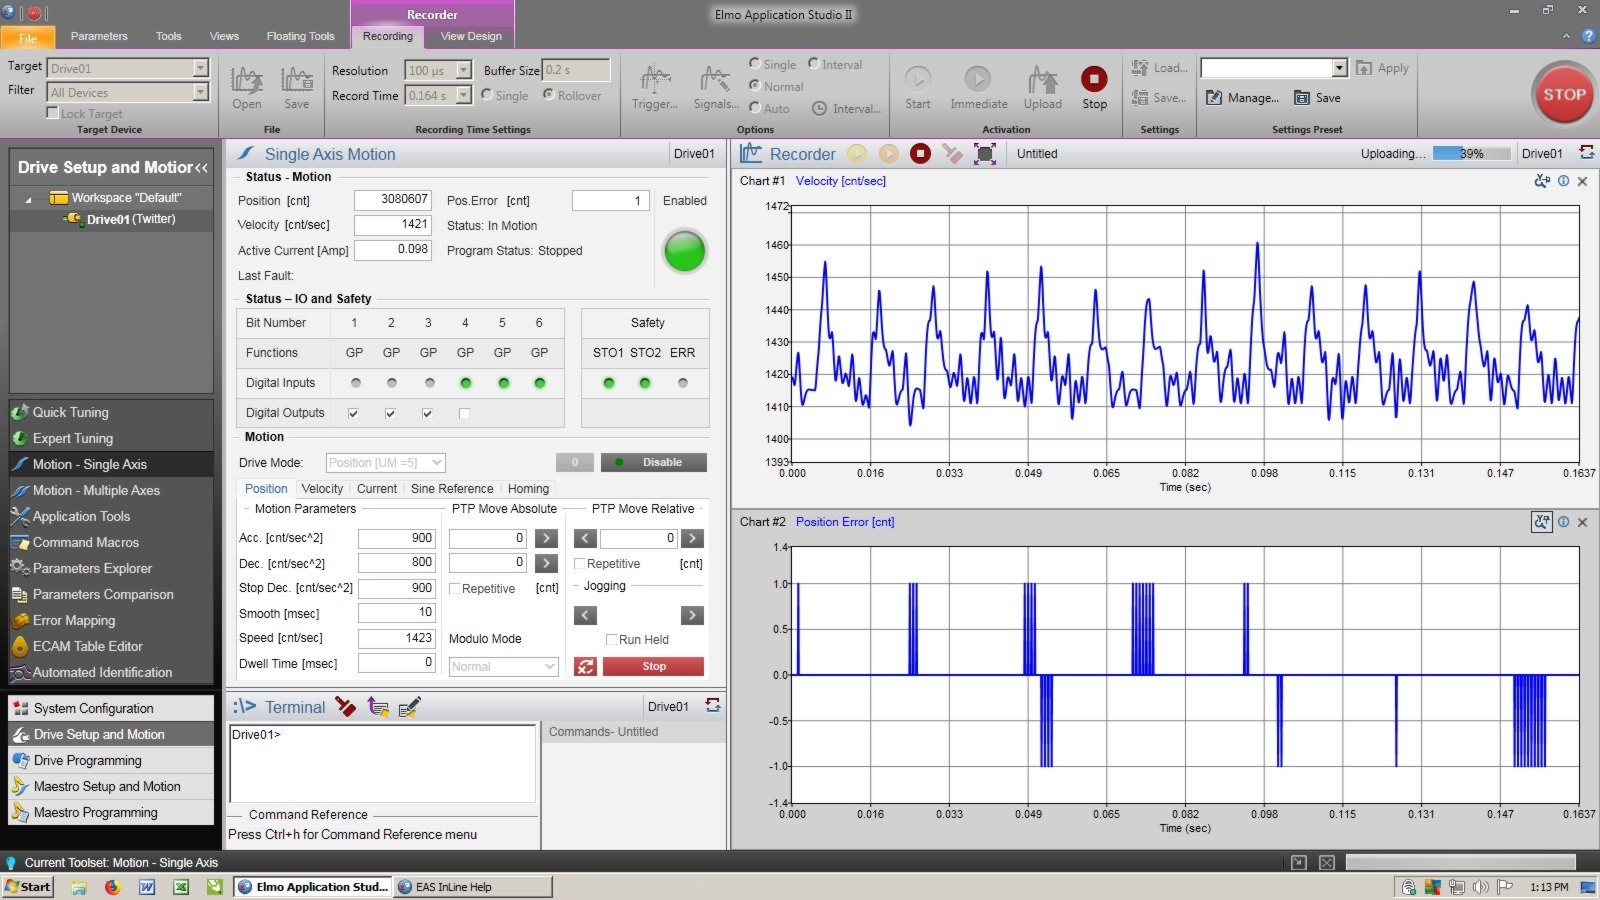
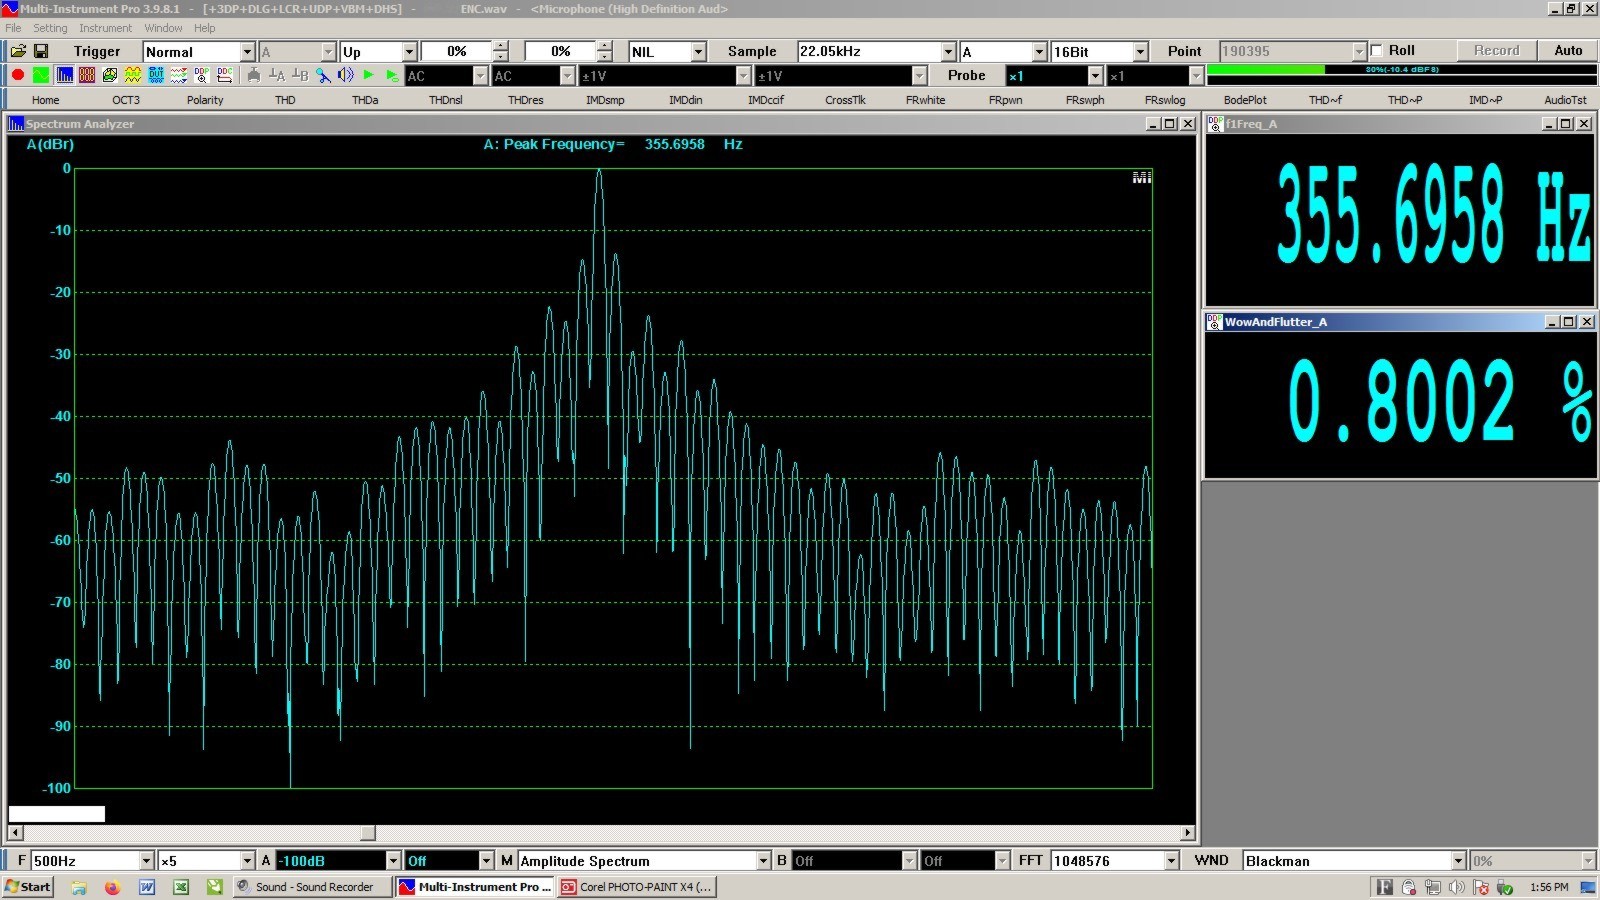
AnalogMagik Graphs are shown on your computer screen, correct?
1. take a screenshot, open it, crop it, save it as a .jpeg
2. get it online somehow (my method below).
3. insert the online image in your post here
///////////////////////////////
My method to get an image online:
I made a Virtual System on this site, ’misc’ to upload any image from my computer to that virtual system so I can insert it in my posts.
https://www.audiogon.com/systems/11519
3. open the image ONLINE, right click it, ’copy image address’ (it’s url)
4. now, in a window here, top line, 6th icon from the left, click ’Image’
paste the image address (url) you copied
size: width, change it to 555 (height will be automatically changed).
click OK
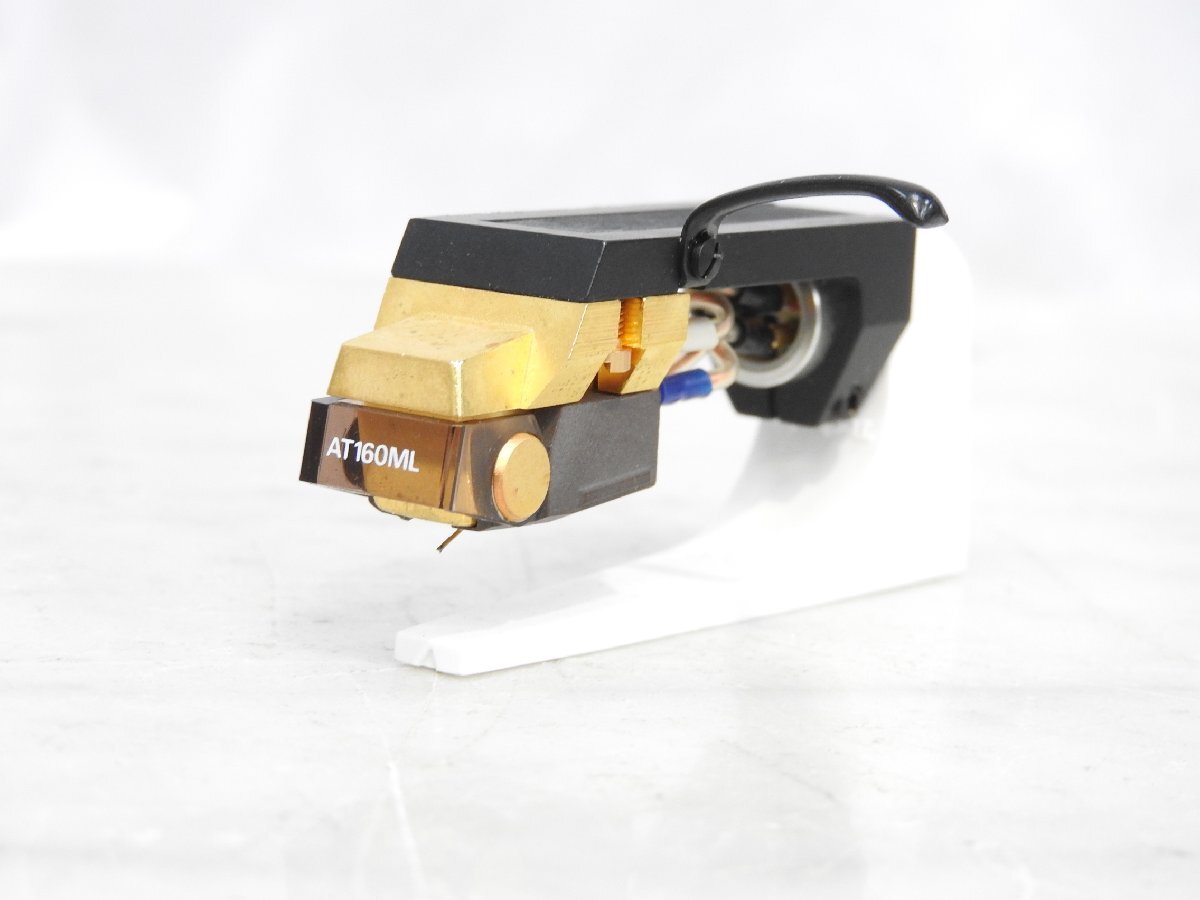
example: here’s my current favorite cartridge (right clicked image from Yahoo Auction web site)
//////////////////////////////////////
Screenshot (change it to .jpeg)
I don’t know Apple, but Windows, keyboard:
a. hold the windows symbol key (bottom left area) and the Prt SC key (top right area) at the same time, bingo, in Pictures, there is a ’Screenshots’ folder, there it is with a number that you can rename. It is a .png which you will convert to a .jpeg
b. double click it, Windows Photo app will open it, and it is the whole monitor screen, you click EDIT top left, then crop it.
c. Save AS Copy
pick a location so you can find it, or let it put it in the default ’Pictures’ folder
rename it
change the type (drop down box) from .png to .jpeg
Couldn’t be easier.